Dashboards Overview
The Dashboards include graphs of all network activity that has passed through Network Security's active servers (see Activating Powertech Network Security) within a specified time range. Use the dashboards for viewing and analyzing data from across your network all on one screen.
The configuration of the Dashboard (e.g. selection of 24-hour statistic charts displayed in the Dashboard) is saved for each individual user. You can create more than one dashboard, sharing them with everyone or keeping them private, as needed. You can use any combination of widgets in the same dashboard.
How to Get There
Click Dashboards in the Navigation Pane to view your Dashboards.
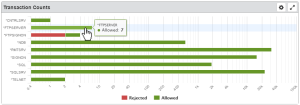
All servers with one or more transactions appear in the Dashboard's top graph.
Green indicates transactions that have been allowed. Red indicates transactions that have been rejected.
Choose the  buttons to isolate allowed or rejected transactions.
