Overview
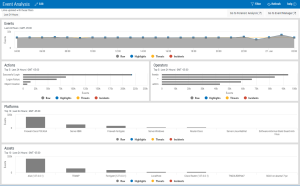
Event Analysis is an interactive display of security event activity across your enterprise over a given time period.
The display is comprised of five panels showing the following information:
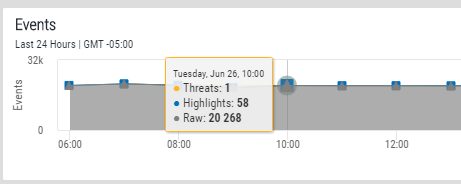
- Events: Displays a graphical line chart showing the audit trail of security events raised by the monitored systems in your enterprise.
- Actions: Displays a horizontal bar chart showing the Top 5 actions that raised the most security events.
- Operators: Displays the user names of the Top 5 user profiles that raised the most security events.
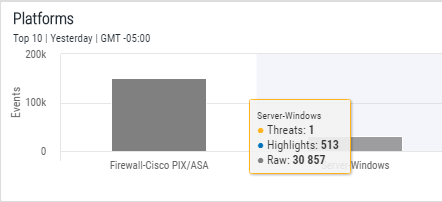
- Platforms: Displays the Top 10 operating systems in your enterprise that generated the most security events.
- Assets: Displays the Top 10 assets in your enterprise that generated the most security events.
For each panel in this display, the following security event information is available:
- Raw: This is the audit trail of all security events received by Event Manager over the given time period.
- Highlights: A highlight is a security event not deemed severe enough to be considered a threat or incident but warrants further manual investigation.
- Threats: A threat is an event deemed serious enough to put your business at risk and should be investigated as a matter of urgency.
- Incidents: An incident means that security has been breached. This is the highest level of event possible.
Accessing information in the display
From within each of the panels on the Event Analysis display it is possible to get a breakdown of the security events .
Event information is displayed in time slots across the chosen time range.
Hover the mouse pointer over the top of the key indicator point to view specific information for that particular time point.

Action information is displayed by the number of events recorded against specific actions. The Top 5 Actions are displayed.
Hover the mouse pointer over any point on the horizontal bar chart to view specific information for that number of events.

Click on any point on within each of the graphical bars to drill-down into the information for the selected action. For example, clicking on the Successful Login action bar will filter the whole display for events relating to Successful Logins. See Drill-down Analysis for more information.
Operator information is displayed by the number of events recorded against user profiles. The Top 5 Operators are displayed.
Hover the mouse pointer over any point on the horizontal bar chart to view specific information for that number of events.

Click on any point on within each of the graphical bars to drill-down into the information for the selected operator profile. For example, clicking on the QUSER operator bar will filter the whole display for events relating to the QUSER user profile. See Drill-down Analysis for more information.
Platform information is displayed by the number of events recorded against specific operating platforms. Where applicable, security event data for the Top 10 Operating Platforms is displayed, otherwise this panel is restricted to the number of operating platforms you have available across your enterprise.
Hover the mouse pointer over any graphical point on the bar chart to view specific information for the number of events for the specific platform.

Click on any point on within each of the graphical bars to drill-down into the information for the selected action. For example, clicking on the Server-IBMi bar will filter the whole display for events relating to the Server-IBMi platform. See Drill-down Analysis for more information.
Asset information is displayed by the number of events recorded against specific assets on your enterprise. Security event data for the Top 10 Assets is displayed.

Hover the mouse pointer over any graphical point on the bar chart to view specific information for the number of events for the specific platform.
Click on any point on within each of the graphical bars to drill-down into the information for the selected action. For example, clicking on the LocalHost bar will filter the whole display for events relating to the LocalHost asset. See Drill-down Analysis for more information.
Changing the Security Event Data that is displayed
Within each of the panels (with the exception of the Events panel) on the Event Analysis display, it is possible to edit the content.
Click the ![]() Edit icon in the top-right corner of the panel. The content that can be edited is different for each panel but the process is the same.
Edit icon in the top-right corner of the panel. The content that can be edited is different for each panel but the process is the same.
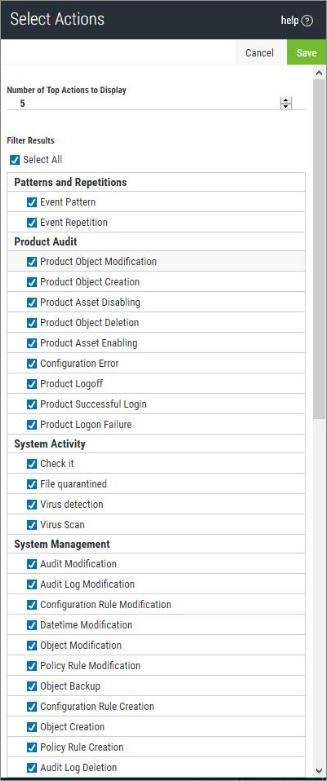
The Select Actions/Operators/Platforms/Assets panel is displayed.

Top X
Select All
Individual Options
Click Save to confirm the amendments to the panel.
Displaying or excluding data for a single security event type
The default setting shows all event types (Raw, Highlights, Threat or Incident) in each panel of the Event Analysis display.
From within each panel it is possible to show information by a single event type or by excluding events of a specific type from the display. This can make it easier to process the available information by removing the visibility of those security events that are not required.
Displaying single security event type data
To show a single security event type from within any panel in the Event Analysis display, hover the mouse pointer over the top of the event type within that panel.
For example, in the Events panel, if you hover the mouse pointer over the Highlights indicator in the legend, only highlighted events are displayed, as shown in the screen shot below:

Excluding single security event type data
To exclude a single security event type from within any panel in the Event Analysis display, click on the event type within that panel.
For example, in the Events panel, if you click on the Highlights indicator in the legend, highlighted events are excluded from the display, as shown in the screen shot below:

Viewing a panel full screen
If a panel contains a lot of information that is difficult to read in the limitations of the current size, it is possible to view the contents of the panel in full-screen mode.
Click the ![]() full screen icon in the top right-hand corner of the panel to increase the display to full screen.
full screen icon in the top right-hand corner of the panel to increase the display to full screen.
Click the ![]() reduce screen icon to close the full screen view and return the panel to the original size.
reduce screen icon to close the full screen view and return the panel to the original size.
Drill-down Analysis
Drill-down analysis provides a way of interrogating the security event data to pinpoint specific security events using just this display. Further itemized information can then be obtained from the Event Manager and Forensic Analysis displays.
In the following example, the drill-down investigates a successful login reported as a threat on the Windows operating platform for the asset LocalHost.
In the Actions panel the mouse pointer is hovered over the Successful Login bar chart to reveal that there was a single instance of a possible security threat.

Click on the Successful Login bar. The entire Events Analysis display is updated as a drill-down has been performed on the Successful Login action. This is shown in the Event Analysis Header Bar.

Further investigation reveals that the threat was actioned on the Windows Server.

Click on the Server - Windows bar. The Events Analysis display is updated again with the new-drill down request and the header is also updated.

In the Assets panel, only the LocalHost asset is displayed.

Finally, in the Operator's panel, remove all the events other than the Threats. This reveals that the Security Threat was on the Administrator's user profile.

Further investigation can now be undertaken using the Event Manager and Forensic Analysis displays.
Resetting the display
Following a drill-down analysis the display can be reset to the original setting in one of two ways.
Either:
Click on the name of the drill-down filter setting in the Event Analysis header bar to remove the filter.

Or
Click on the  Reset button in the top-right corner of each panel that has had a drill-down filter applied.
Drill-down by Time Period
From the Events panel at the top of the display, it is possible to drill-down into a specific time range from within the time period currently displayed.
Click at the point on the graph at which you want the time-range drill-down to begin and keeping your finger on the button, drag the mouse to the time point where you want the range to end. The selected time range is highlighted in blue. Release the mouse button.

As with other drill-down mechanisms, the time range filter selection is shown in the header bar.

The data in the four remaining panels on the Event Analysis display also changes to reflect the data available for the filtered time range.
You can continue to filter down by time-range, (using the same method as just described) or you can filter on any of the other panels as explained in the Drill-down Analysis section.
See Resetting the Display for instructions on how to return to the original view.
Refreshing the data
By default, the data in the Events Analysis display is auto-refreshed every 5 minutes.
You can also perform a manual refresh of the display by clicking the  Refresh button in the main header bar of the Event Analysis display.
