System Summary Dashboard Widget
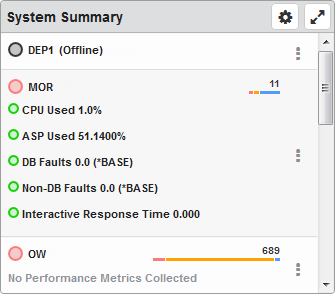
For the selected system, this widget displays the number of directory events (added, removed, changed, or threshold) that were monitored over a period of time. Note: You can set up event monitors using either the Robot NetworkExplorer or the IBM i.
Things you can do:
- ClickTap
 Maximize to view the widget full-screen. ClickTap
  X to view it on the dashboard again.
 -
ClickTap a system to view its Status Center page.
-
ClickTouch the severity statuses data to switch between the number and the type of statuses.
-
ClickTap the Show Actions button
 for any system to display its options.
-
Select Status Center to view the Status Center page for the selected system.
-
Select Performance Details to view the Performance Details page for the selected system.
-
Select Stop to open the Stop Robot Network dialog. You can decide to stop the node or the host.
-
Select Start to open the Start Robot Network dialog. You can decide to start the node or the host.
Note: The correct authority, including log in and password, is required to stop or start Robot Network.
-
To change the settings:
-
ClickTap
 Settings on the widget.
 -
Type a new Name, if necessary.
-
ClickTap Reset Name to have the software create a name based on the widget and the settings you've selected.
Note: If you're using the system-generated name, be sure to click Reset Name before saving so that a new name can be generated, if needed.
-
Select the display Size of the widget on the dashboard. This affects the height of the widget.
-
ClickTap the Auto-Refresh button to enable it (Yes) or disable it (No).
-
Type the number of minutes between each Auto-Refresh (Min).
-
Select the Lowest Severity for the data you want displayed: Offline, Attention, Warning, or Informational.
-
Select the Systems to display.
If you select Host, Node, or Node Group, clicktap Look Up to select the systems you want.
-
ClickTap Save.
Note:ClickTap Delete to delete this widget from the dashboard.
Robot Network widget descriptions