Dashboards Overview
Today's data driven organizations require high-performance processing of information that is displayed in a dynamic fashion. The Dashboard is an executive interface that offers this capability by providing graphical representations of real-time data, historical events, and performance metrics which are all accessible from a central location. It delivers greater visibility and control of critical business processes, allowing you to spot trends, react quickly to problems and make informed decisions based on the information you see at a glance.
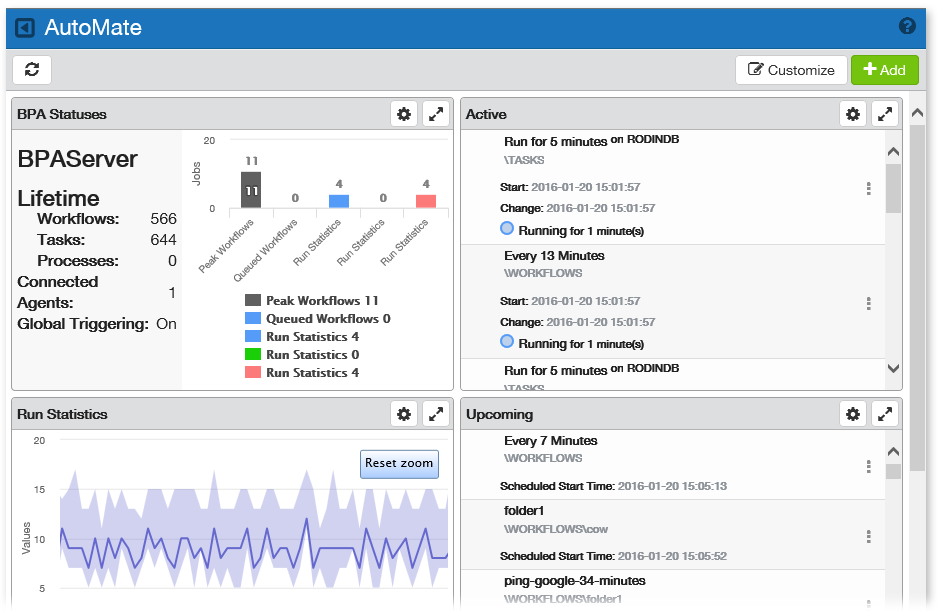
The dashboard is made up of one or more customizable Widgets, which are gadgets that presents specific data types in various formats, such as charts, tables or graphs. Widgets provide "snapshots" of your work environment and helps you keep an eye on your workflows and the logical tasks, processes, and conditions that they coordinate.
To access the Dashboards page, from the side menu, clicktap Dashboard under the Automate Enterprise menu, then select the dashboard you wish to view from the list. If the menu on the left is hidden, clicktap the Menu  button in the upper left corner to show it. For more details, see Managing Dashboards.
Dashboard Notes:
- You can create more than one dashboard and add as many widgets to a dashboard as needed.
- Any combination of widgets can be added to a dashboard, including widgets from other products or duplicate widgets.
- Dashboards are exclusive to the profile that is currently logged on. However, you can share them with others or keep them private, as needed.
- Users logging on with the guest profile can view only those dashboards marked as Guest.
- To view a list of available Automate Enterprise widgets, see Automate Enterprise Widget Descriptions.