Statistics - Completed Statistics Widget
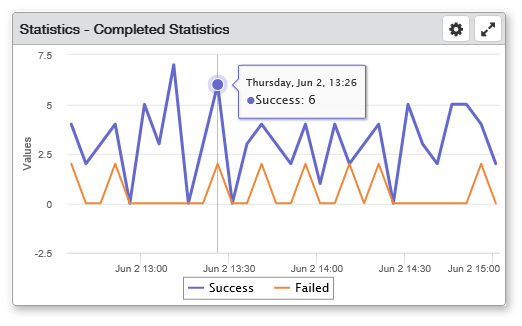
The Completed Statistics widget displays success/failure statistics of completed workflows, tasks, and processes presented in the form of an interactive line chart. The vertical y axis represents the amount of successful and/or failed executions being measured and the horizontal x axis represents the timeline by which the measurements are made. This widget can be used to examine the outcome of a collection of completed execution events performed over a period of time in order to detect trends, patterns, or cycles.
To add a Completed Statistics widget, from your Automate Enterprise dashboard, click Add and select Statistics - Completed Statistics. For more details on creating and editing widgets, see Managing Widgets.
Things to know and do:
- By default, the chart displays both Success and Failed statistics. To hide specific stats, click either Success or Failure from the legend (positioned below the timeline).
- Hover your mouse cursor over a specific point in the graph to display a tooltip text showing the total number of success/failed executions for a given time period. The tooltip follows with updated information as you move the cursor to each point in the graph.
- Double-click a specific point in the graph to display a history of success/failed executions that occurred during that time period.
- Click and drag your mouse cursor horizontally in the grid area to zoom the display to a shorter timeline. The highlighted portion will become the new timeline once you release the mouse button. Click Reset zoom to revert back to the original view.
- ClickTap the Maximize
 button to view the widget full-screen. ClickTap the X
  button to view it on the dashboard again.
 - ClickTap Delete on the top of the page to permanently delete the widget from the dashboard.
- ClickTap the Refresh
 button to refresh the information in the display.
Available Settings:
Click the Settings  button to access available settings for the widget. Automate Enterprise Status settings are as follows:
- Name: A unique name for the widget. This widget is named Statistics - Completed Statistics by default, however, it can be renamed to something that may be more suitable to you.
- Reset Name: Allows the software to create a widget name based on the type of widget and the settings you've selected.
- Size: The size of the widget as it appears on the dashboard. This affects the height of the widget (set to Medium by default).
- Auto-Refresh: Enables (On) or disables (Off) auto-refresh mode, which automatically reloads the most current data to be displayed (set to Off by default).
- Auto-Refresh (Mins): The number of minutes between each auto-refresh. The default value is 5 minutes. If the Auto-Refresh parameter is set to Off, this parameter is ignored.
- Folder: Gather and calculate completion statistics from only certain objects that belong to a specific folder or sub-folder. Click the drop-down
 button and navigate to the desired folder.
 - Object Type: Gather and calculate completion statistics from only the type of object specified. The available options are:
- All - Completion statistics will be gathered from all automation objects.
- Workflows - Only workflow completion statistics will be gathered.
- Tasks - Only task completion statistics will be gathered.
- Processes - Only process completion statistics will be gathered.
- Search By: Specifies which element(s) will be searched when entering a keyword in the Search Text dialog. The available options are:
- Agent - The search quarry will include agents.
- Name - The search quarry will include object names.
- Search Text: Performs a search quarry and returns matching records based on the keyword(s) entered and the Search By elements specified.
- Filter By: Narrows the list of records to display based on the following criteria:
- Conditional - Only statistics of conditional objects will be included.
- Manually Run - Only statistics of objects that were manually started (via SMC or Insite) will be included. Statistics of triggered objects will be omitted.
- Not Scheduled - Only statistics of unscheduled objects will be included. Statistics of objects that were started by a Schedule trigger will be omitted.
- Scheduled - Only statistics of objects that were started by a Schedule trigger will be included. Statistics of objects that were not started by a Schedule trigger will be omitted.
- Triggered - Only statistics of objects that were started by any trigger will be included. Statistics of objects that were manually run will be omitted.
- Systems: For those with multiple Automate Enterprise components, specifies which server to collect data from. The available options are:
- Default System - Data is gathered from the default Automate Enterprise specified in the Preferences page.
- Selected System- Allows you to select a specific Automate Enterprise to gather data from. If this option is chosen, clicktap Look up under System to select the server from which to gather data.
Click Save to save changes.