Activity - Deviation Widget
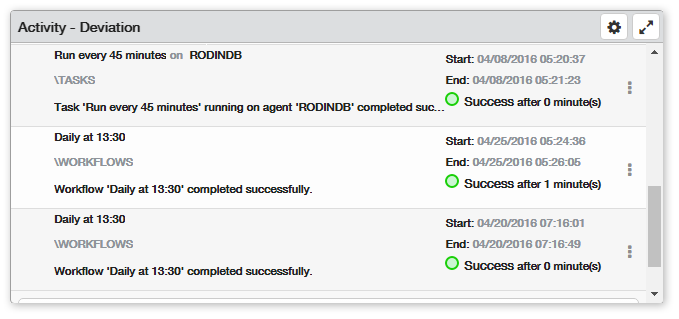
The Deviation widget displays information about workflow, task, and process instances that ran slower or faster than the defined standard deviation limit. Typically, this information can be used to gather accurate runtime metrics and determine whether workflows and tasks are performing as expected or consuming additional resources. You can customize the time frame ill be used to collect and calculate runtime data.
To add a Deviation widget, from your Automate Enterprise dashboard, click Add and select Activity - Deviation. For more details on creating and editing widgets, see Managing Widgets.
Things to know and do:
- ClickTap the Maximize
 button to view the widget full-screen. ClickTap the
  button to view it on the dashboard again.
 - ClickTap the Refresh button
 to refresh the information in the display.
 - ClickTap Delete on the top of the page to permanently delete the widget from the dashboard.
Actions to perform:
ClickTap the Show Actions  button located at the very right of any record to display available actions for monitoring and managing it. Actions vary depending on whether the selected record pertains to a workflow, task, or process.
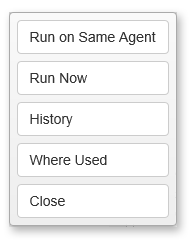
Available actions are described below:
- Run on Same Agent: Immediately runs the task or process on the same agent that it previously ran on (this action only pertains to tasks or processes).
- Run Now: Immediately runs the workflow or immediately runs the task or process on the specified agent.
- History: Displays historic data gathered from previous runs of the object.
- Where Used: Shows the workflows that use the task or process or shows the tasks or processes that use the workflow.
- Close: Closes the Actions pop-up menu.
Available Settings:
Click the Settings  button to access available settings for this widget. They are as follows:
- Name: A unique name for the widget. This widget is named Activity - Deviation by default, however, it can be changed to a name that better suits your establishment or department.
- Reset Name: Allows the software to create a widget name based on the type of widget and the settings you've selected.
- Size: The size of the widget as it appears on the dashboard. This mainly affects the height of the widget (set to Medium by default).
- Auto-Refresh: Enables (On) or disables (Off) auto-refresh mode, which automatically reloads the most current data according to the time interval specified (set to Off by default).
- Auto-Refresh (Mins): The time interval in minutes between each auto-refresh. If the Auto-Refresh parameter is set to Off, this parameter is ignored.
- Percent of Deviation: The percentage amount from standard duration to be considered a deviation. The system considers workflow, task, or process execution a deviation when its total runtime duration goes either above or below the average runtime duration by this percentage.
- Deviation Direction: Use the following indicators to define the deviation direction to monitor. The available options are:
- Above - Duration deviations that surpass the average duration will be monitored.
- Below - Duration deviations that fall below the average duration will be monitored.
- Both - Duration deviations that either surpasses or falls below the average duration will be monitored.
- Time Range: The time frame that will be used to collect and calculate runtime data. The system calculates the average runtime from executions that took place within the time range selected below:
- Today - Runtime data will be collected from executions that happened today, between 12:00 am until the present time.
- Yesterday - Runtime data will be collected from executions that occurred yesterday between 12:00 am to 11:59 pm.
- Last Week - Runtime data will be collected from executions that took place the past seven days (including today), starting 12:00 am of the first day until the present time.
- Folder: Data will be collected from only certain automation objects that belong to the folder or sub-folder specified (set to All by default). Click the drop-down
 button and drill down to the desired folder.
 - Systems: For those with multiple Automate Enterprise components installed, specifies which server to collect data from. The available options are:
- Default System - Displays data from the default Automate Enterprise specified in the Automate Enterprise Preferences page.
- Selected System- Allows you to select a specific Automate Enterprise to gather data from. If this option is chosen, clicktap Look up under System to select the server from which to gather data.
Click Save to save changes.