Statistics - Run Statistics Widget
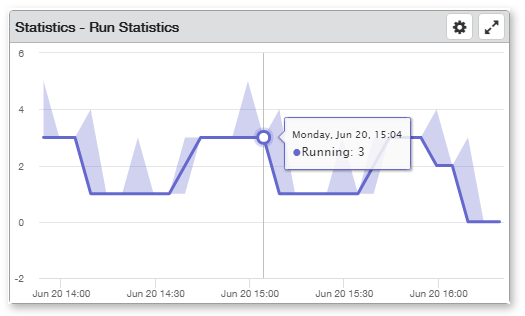
The Run Statistics widget displays execution statistics presented in the form of an interactive line chart. The vertical y axis represents the run instances being measured and the horizontal x axis represents the units of time by which the measurements are made. This widget can be used to examine a collected sequence of run data performed over a specific period of time in order to detect trends, patterns, or cycles.
To add a Run Statistics widget, from your Automate Enterprise dashboard, ClickTap Add and select Statistics - Run Statistics. For more details, see Managing Widgets.
Things to know and do:
- ClickTap the Maximize
 button to view the widget full-screen. ClickTap the
  button to revert back to the original dashboard view.
 - ClickTap the Refresh
 button to update the display with the most current data.
 - ClickTap Delete on the top of the page to permanently delete the widget from the dashboard.
Available Settings:
Click the Settings  button to access available preferences for the widget, such as widget size, auto-refresh values, and filter parameters. The available settings are as follows:
- Name: A unique name for this widget. The default name is Statistics - Run Statistics, however, this can be changed to a name that is more suitable for you.
- Reset Name: Allows the software to create a name for this widget based on the type of widget and the settings you've selected.
- Size: The size of the widget as it appears on the dashboard. This mainly affects the widget's height.
- Auto-Refresh: Enables (On) or disables (Off) auto-refresh mode, which automatically reloads the most current data to be displayed (set to Off by default).
- Auto-Refresh (Mins): The number of minutes between each auto-refresh. If Auto-Refresh is turned Off, this parameter is ignored.
- Interval (Mins): The default interval (in minutes) that this widget's timeline should display.
-
Folder: Displays history of only certain objects that belong to a specific folder or sub-folder (set to All by default). To drill down the folder hierarchy, click the drop-down
 button and navigate to the desired folder.
- Filter By: If the Object Type parameter above is set to Workflows, statistics can be further narrowed based on the criteria selected.
- All - Run statistics will be collected from all workflows.
- Conditional - Only run statistics from workflows that contain a specific condition (i.e., Event Log, Performance, or Service condition) will be collected.
- Manually Run - Only run statistics from workflows that were manually started (via SMC or Ops Console) will be collected. Statistics from triggered workflows will be omitted.
- Not Scheduled - Only run statistics from unscheduled workflows will be collected. Statistics from workflows that were started by a Schedule trigger will be omitted.
- Scheduled - Only run statistics from workflows that were started by a Schedule trigger will be collected. Statistics from workflows that were not started by a Schedule trigger will be omitted.
- Triggered - Only run statistics of workflows that were started by a trigger will be included. Statistics of workflows that were manually run will be omitted.
- Automate Enterprise: Specifies which Automate Enterprise and optionally, which agent to gather run statistics from. The available options are:
- Default Automate Enterprise - Statistics are gathered from the default Automate Enterprise specified in the Preferences page.
- Selected Automate Enterprise- Allows you to select a specific Automate Enterprise and optionally, a specific agent within that server from which to gather statistics. If this option is chosen, clicktap Look up under the Automate Enterprise and Agent fields to select a specific server and agent from which to gather statistics. If the Agent field is left blank, statistics will be gathered from all agents.
Click Save to save changes.